Customize a Dashboard Report
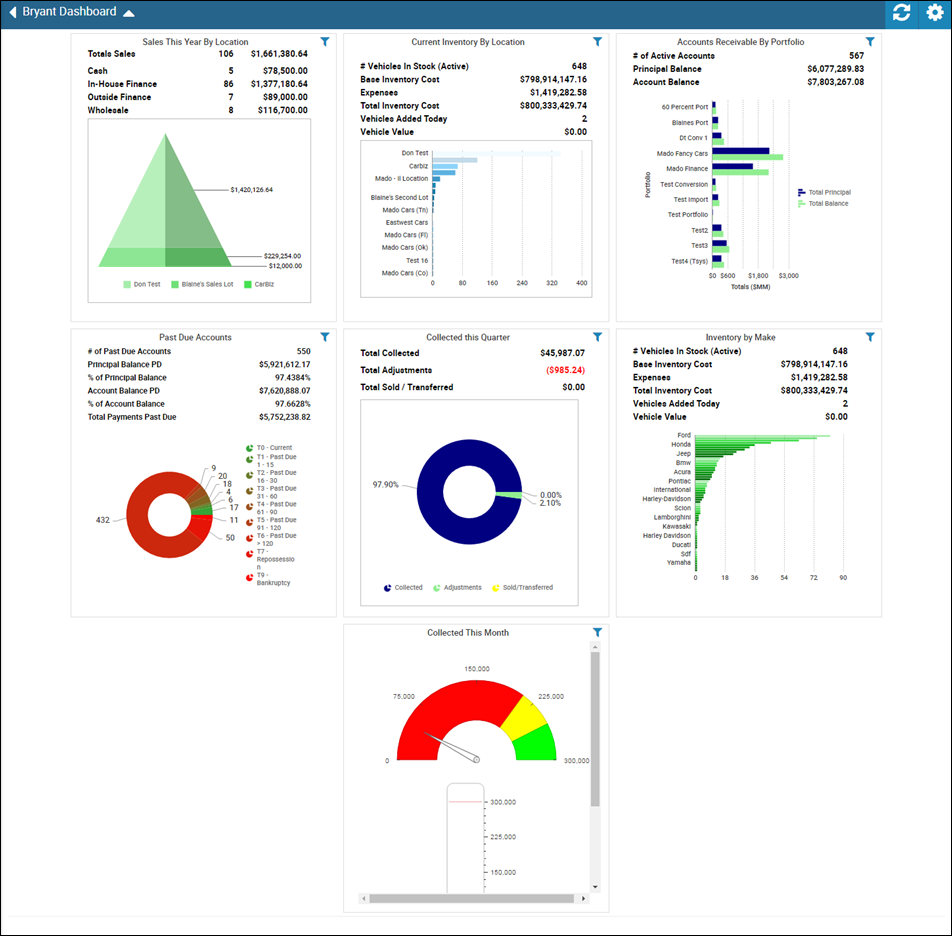
After you add reports to your dashboard, you can customize the report views. The following is an example of a customized dashboard with several reports. The dashboard automatically refreshes periodically, but you can click the Refresh icon ![]() to manually retrieve real time report data. You can also click the Settings icon
to manually retrieve real time report data. You can also click the Settings icon ![]() to re-customize the dashboard. See Customize My Dashboard. Additionally, hover over the Filter icon
to re-customize the dashboard. See Customize My Dashboard. Additionally, hover over the Filter icon ![]() to view the parameters currently assigned to the report.
to view the parameters currently assigned to the report.
To customize a report on the dashboard
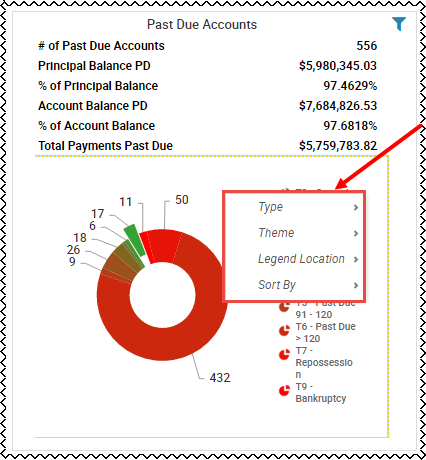
- Right click the report you are customizing.
A list of options appears. You can choose from Type, Theme, Legend Location, and Sort By.
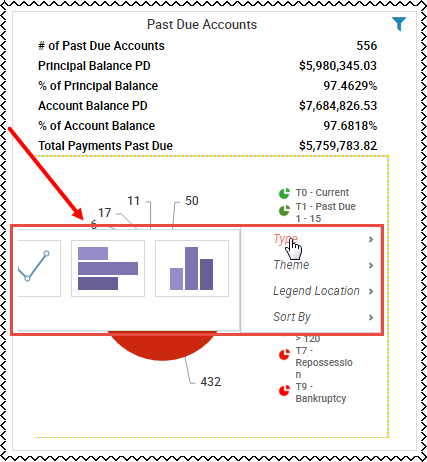
- Hover over the option you want to use, and a list appears. In the following example, you are viewing the different types to choose from, such as line and bar graphs.
- In the following example, you can also click the graph and choose from more options.
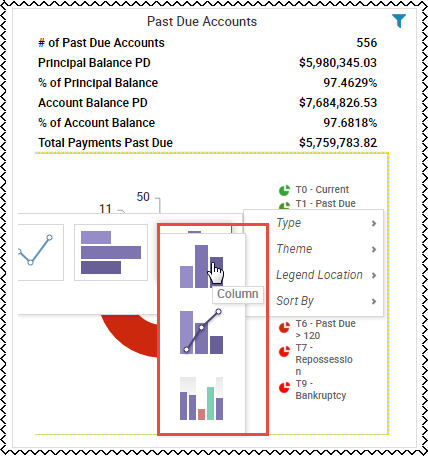
- Make new selections as needed.